Analyzing Oil Price Trends
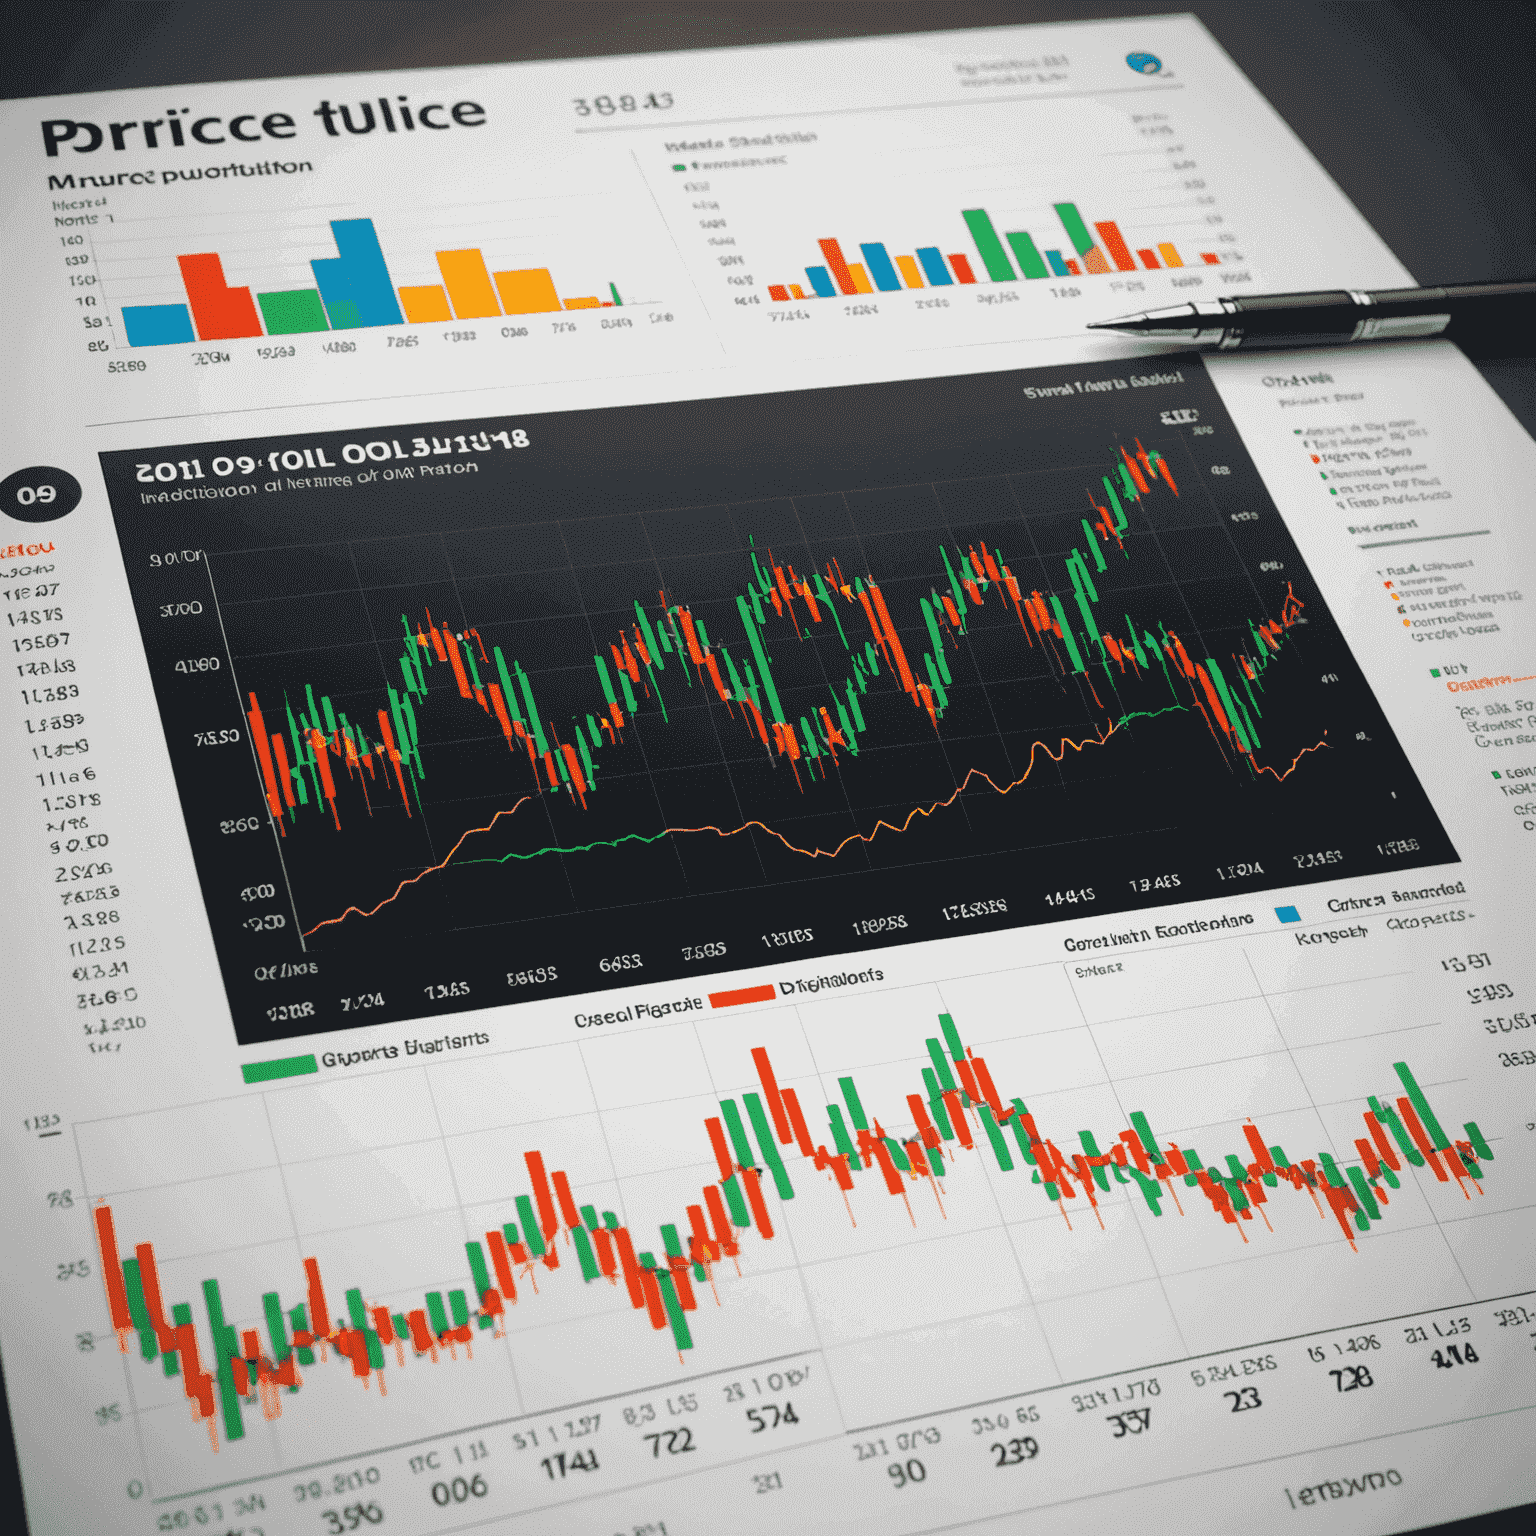
In the volatile world of oil trading, understanding and predicting price trends is crucial for making informed decisions and generating a steady stream of passive income. This article explores effective methods and key indicators for analyzing oil price movements.
Fundamental Analysis
Fundamental analysis involves examining the underlying factors that influence oil prices:
- Global supply and demand dynamics
- Geopolitical events and tensions
- OPEC decisions and production quotas
- Economic indicators and growth forecasts
- Technological advancements in energy production
Technical Analysis
Technical analysis uses historical price data and statistical indicators to identify patterns and predict future movements:
- Moving Averages (MA)
- Relative Strength Index (RSI)
- Bollinger Bands
- Fibonacci Retracements
- Volume analysis

Key Economic Indicators
Several economic indicators can provide valuable insights into oil price trends:
- US Dollar Index (DXY)
- Crude Oil Inventories
- Manufacturing PMI
- GDP growth rates
- Interest rates and monetary policy
Sentiment Analysis
Gauging market sentiment can offer additional context for price movements:
- Commitment of Traders (COT) reports
- Social media and news sentiment analysis
- Analyst forecasts and consensus estimates
Combining Methods for Robust Analysis
To make the most informed trading decisions, it's crucial to combine multiple analysis methods:
- Start with a broad fundamental analysis to understand the overall market context.
- Use technical analysis to identify potential entry and exit points.
- Monitor key economic indicators for confirmation of trends or potential reversals.
- Incorporate sentiment analysis to gauge market psychology and potential overreactions.
Conclusion
Mastering the art of analyzing oil price trends requires a multifaceted approach and continuous learning. By combining fundamental analysis, technical indicators, economic data, and sentiment analysis, traders can develop a more comprehensive understanding of market dynamics. This holistic approach can lead to more accurate predictions and, ultimately, more successful trading strategies in the pursuit of steady passive income through oil trading.
Remember, while these methods can provide valuable insights, oil trading carries inherent risks. Always conduct thorough research and consider seeking advice from financial professionals before making investment decisions.